Get in Touch With Us
Call us at +1 423/3443855 +1 423/3443855 with any questions or to schedule an appointment.
Or you may use our contact form.
In order to visit us
Fibonacci Stocks
PO Box
Harrison, 37341
Get Connected!
This page will talk about stock market tops because it is very important for a person to take profits while he or she has them. Before I get into market top indicators, I want to bring up a great market bottom indicator, the NYSE McClellan Oscillator, $NYMO. I have noticed that whenever NYMO is at -80 or below on the chart we are on the verge of a sharp reversal to the upside. Therefore, if you have a shorting stock like TZA, the small cap bear, it is best to take your profit as soon as you notice NYMO is around -80.
As for an intermediate top in the stock market, the NYSE Summation Index, $NYSI, is one of the best indicators. When you see the relative strength, RSI, is over 70%, it is time to sell your long stocks like UDOW and NUGT, and go short with TZA. I have seen this scenario work many times.
Currently, you can also determine a market top from the yield on ten year bonds. Whenever the yield gets around 2%, it is time to sell your long stocks. This is particularly true in April so that you can take your profits before the usual May sell-off takes place.
Another way to decipher that stocks may be about to fall is to look at a chart of the S&P 100 bullish percent index, $OEXA200R. If the current percent chart has fallen below the 50 day average, it would be wise to go ahead and take your profits. An old Wall Street saying is that "you cannot go broke making a profit."
A fifth indicator worth mentioning is the NYSE Bullish Percent Index, $BPNYA. Sometimes the stock market direction, either up or down, is more clear in this chart than it is in the other charts. Taking a look at several indicators is the best way to know whether you should be invested on the long side of stocks or the short side.
A sixth indicator that needs to be discussed is the volatility index, $VIX. If the volatility index is 15 or lower, there is a good chance that stocks will go higher even if it appears that they are overbought. People will try to get the most for their money, and they often will not buy bonds unless the stock market is going down for certain. I will be tracking $VIX, the Dow index, and three more indicators below.
A seventh worthwhile indicator is the NYSE Advance/Decline Line, $NYAD. This shows whether the stock market is in a long term uptrend or downtrend. If the trend is down, you probably want to stay out of the stock market until the A/D Line reverses along with other important indicators.
Indicator eight would be the S&P 500 Earnings. If the earnings are going down dramatically, that would indicate a market top, especially if the interest rate on the ten year bond is near 3% or higher.
Indicator nine would be lumber. If the price of lumber is going down, then home builders are probably not building too many homes. If the construction industry is in a holding pattern, the stock market might do the same thing.
Indicator ten would be new lows. If NYLOW compared to NYTOT is about .05 or higher, then we are either at a bottom, or we might be headed that way.
Indicator eleven would be to compare bonds to the S&P 500. TLT is my choice to represent bonds while the SPY ETF will show the S&P 500. If TLT is flat or rising while SPY is falling, we may be at a market top, especially if the economy is going down. If TLT is clearly in a downtrend, then it is safe and profitable to be long on stocks.
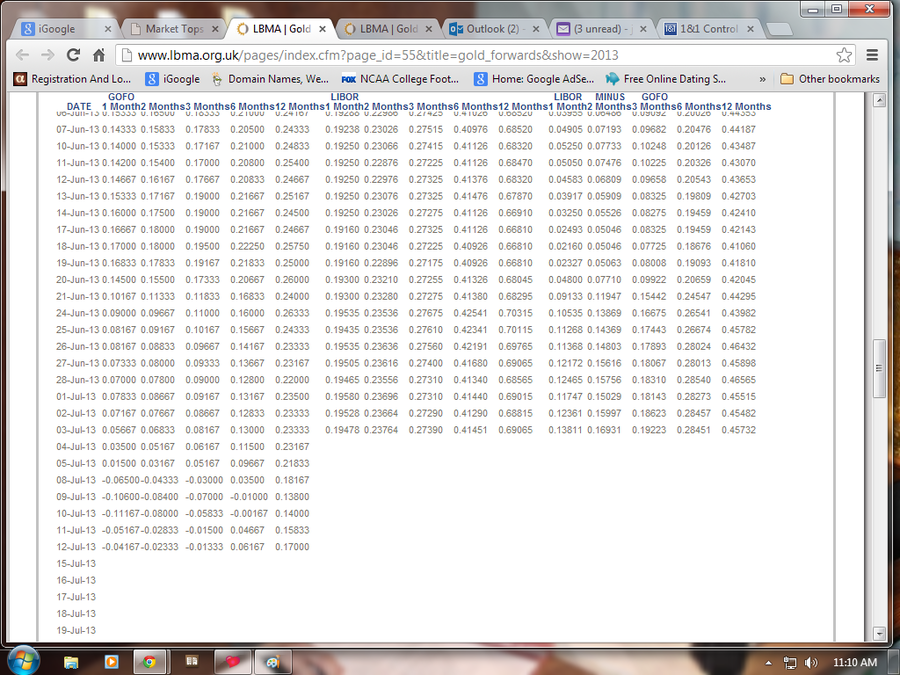
Indicator twelve will involve the London Bullion Market as a sign of a market bottom in gold. This is important because you don't want to buy gold or gold miners when there is more downside than upside. You will want to look at the Gold Forwards (GOFO) page. If the table has negative values for GOFO, then the price for obtaining gold delivery has gone up, and gold demand is outweighing the supply. Countries in the Middle East along with India and China are highly interested in amassing gold. I have shown below the July 2013 portion of the table which displays negative delivery cost values.
As for an intermediate top in the stock market, the NYSE Summation Index, $NYSI, is one of the best indicators. When you see the relative strength, RSI, is over 70%, it is time to sell your long stocks like UDOW and NUGT, and go short with TZA. I have seen this scenario work many times.
Currently, you can also determine a market top from the yield on ten year bonds. Whenever the yield gets around 2%, it is time to sell your long stocks. This is particularly true in April so that you can take your profits before the usual May sell-off takes place.
Another way to decipher that stocks may be about to fall is to look at a chart of the S&P 100 bullish percent index, $OEXA200R. If the current percent chart has fallen below the 50 day average, it would be wise to go ahead and take your profits. An old Wall Street saying is that "you cannot go broke making a profit."
A fifth indicator worth mentioning is the NYSE Bullish Percent Index, $BPNYA. Sometimes the stock market direction, either up or down, is more clear in this chart than it is in the other charts. Taking a look at several indicators is the best way to know whether you should be invested on the long side of stocks or the short side.
A sixth indicator that needs to be discussed is the volatility index, $VIX. If the volatility index is 15 or lower, there is a good chance that stocks will go higher even if it appears that they are overbought. People will try to get the most for their money, and they often will not buy bonds unless the stock market is going down for certain. I will be tracking $VIX, the Dow index, and three more indicators below.
A seventh worthwhile indicator is the NYSE Advance/Decline Line, $NYAD. This shows whether the stock market is in a long term uptrend or downtrend. If the trend is down, you probably want to stay out of the stock market until the A/D Line reverses along with other important indicators.
Indicator eight would be the S&P 500 Earnings. If the earnings are going down dramatically, that would indicate a market top, especially if the interest rate on the ten year bond is near 3% or higher.
Indicator nine would be lumber. If the price of lumber is going down, then home builders are probably not building too many homes. If the construction industry is in a holding pattern, the stock market might do the same thing.
Indicator ten would be new lows. If NYLOW compared to NYTOT is about .05 or higher, then we are either at a bottom, or we might be headed that way.
Indicator eleven would be to compare bonds to the S&P 500. TLT is my choice to represent bonds while the SPY ETF will show the S&P 500. If TLT is flat or rising while SPY is falling, we may be at a market top, especially if the economy is going down. If TLT is clearly in a downtrend, then it is safe and profitable to be long on stocks.
Indicator twelve will involve the London Bullion Market as a sign of a market bottom in gold. This is important because you don't want to buy gold or gold miners when there is more downside than upside. You will want to look at the Gold Forwards (GOFO) page. If the table has negative values for GOFO, then the price for obtaining gold delivery has gone up, and gold demand is outweighing the supply. Countries in the Middle East along with India and China are highly interested in amassing gold. I have shown below the July 2013 portion of the table which displays negative delivery cost values.
Indicator 13 would be the NYSE New Highs Index. This is a volatile index, but if the new highs appear to be descending peaks that are getting shorter and shorter, it signifies that we are probably headed for a downtrend.
As of June 28, 2013, I will only be documenting the table below on an intermittent basis because the weekly table was getting too long. I will try to record new data whenever a paradigm change has happened. Viewing the statistics only once in a while will also show bigger changes in the values. Trends will be more clear in this way.
As of June 28, 2013, I will only be documenting the table below on an intermittent basis because the weekly table was getting too long. I will try to record new data whenever a paradigm change has happened. Viewing the statistics only once in a while will also show bigger changes in the values. Trends will be more clear in this way.
| Date | $VIX | Dow Index | SP100 | NYMO | 10-yr bond |
| 3-8-13 | 12.59 | 14,397 | 87 | 27 | 2.06% Int. |
| 3-15-13 | 11.30 | 14,514 | 91 Top | 6 | 2.01 |
| 3-22-13 | 13.57 | 14,512 | 88 | -7.27 | 1.93 |
| 3-29-13 | 12.70 | 14,578 | 88 | 4.25 | 1.87 |
| 4-5-13 | 13.92 | 14,565 | 89 | -38 | 1.72 |
| 4-12-13 | 12.06 | 14,865 | 90 Top | 2.10 | 1.75 |
| 4-19-13 | 14.97 | 14,547 | 83 | -14.87 | 1.73 |
| 4-26-13 | 13.61 | 14,712 | 87 | 18 | 1.70 |
| 5-3-13 | 12.85 | 14,973 | 92 Top | 44 | 1.78 |
| 5-10-13 | 12.59 | 15,118 | 96 Top | 35 | 1.90 |
| 5-17-13 | 12.45 | 15,354 | 96 Top | 16 | 1.95 |
| 5-24-13 | 13.99 | 15,303 | 95 Top | -40 | 2.01 |
| 5-31-13 | 16.30 | 15,115 | 93 | -81 | 2.16 |
| 6-7-13 | 15.14 | 15,248 | 93 | -40 | 2.17 |
| 6-14-13 | 17.15 | 15,070 | 90 | -47 | 2.14 |
| 6-21-13 | 18.90 | 14,799 | 81 | -67 | 2.52 |
| 6-28-13 | 16.86 | 14,909 | 81 | 19 | 2.49 |
| 7-28-13 | 12.72 | 15,558 | 91 | 4 | 2.61 |
| 8-28-13 | 17.01 | 14,810 | 80 | -23 | 2.78 |
| 9-27-13 | 15.46 | 15,258 | 84 | 4.78 | 2.64 |
| 10-25-13 | 13.20 | 15,570 | 85 | 46 | 2.53 |
| Date | $VIX | Dow Index | SP100 | NYMO | 10-yr bond |
| 11-30-13 | 13.70 | 16,086 | 89 | 13 | 2.75 |